

Tushar Chande developed the Chande Momentum Oscillator which is a technical momentum indicator. The Chande Momentum Oscillator indicator is created by calculating the difference between the sum of all recent higher closes and the sum of all recent lower closes and then dividing the result by the sum of all price movements over a given time period. The defined time period is usually 20 periods and so the result is multiplied by 100 to give the -100 to 100 range.
Read Also;
- RIA vs Broker Dealer
- Excess Capacity
- Agent Payments
- Indirect Rollover
- How to Buy Investment Property
How Chande Momentum Oscillator works
Overbought conditions when it reaches the 50 level and oversold conditions when it reaches -50 is indicated by the Chande Momentum Oscillator. Signals can also be looked at based on the CMO crossing above and below a signal line composed of a 9- proof moving average of the 20 period CMO.
The trend strength is measured by the Chande Momentum Oscillator (CMO). The stronger the trend indicates the absolute value of the CMO. While lower absolute values of the CMO indicates sideways trading ranges.
Chart patterns are often forms which may not show on the underlying price chart, such as double tops and bottoms and trend lines. Support or resistance should be looked for on the CMO.
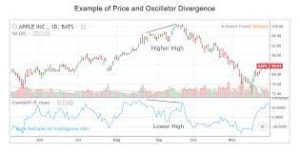
The divergence signals a price reversal if the underlying prices make a new high or low that is not confirmed by the Chande Momentum Oscillator (CMO).

Calculation
CMO = 100 * ((Su – Sd)/ ( Su + Sd ) )
Where:
Su = Sum of the difference between the current close and previous close on up days for the specified period. Up days are days when the current close is greater than the previous close.
Sd = Sum of the absolute value of the difference between the current close and the previous close on down days for the specified period. Down days are days when the current close is less than the previous close.
When the current close equals the previous close it is ignored.
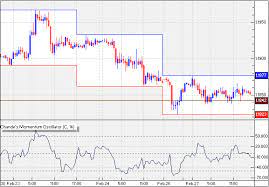
Chande Momentum Oscillator Example
The daily chart of the Australian Dollar (AUDUSD) is plotted with a 20-day Chande Momentum Oscillator.
- In early January 2016, a lower peak on Chande Momentum Oscillator warned of a sell-off. Go short. Exit when Chande Momentum reaches -50.
- Go long when Chande Momentum Oscillator touches the oversold level at -50 then reverses above its signal line. When a lower peak completes a bearish divergence, so exit because Chande Momentum does not reach +50. Exit when Chande Momentum reaches the oversold level of -50.
- Go long when Chande Momentum Oscillator touches the oversold level at -50 then reverses above its signal line. Exit when Chande Momentum reaches the Overbought level of +50.
- When Chande Momentum Oscillator completes a bearish divergence, go short in mid-July. Exit when AUDUSD recovers above the entry point at 0.75.
- If in late August, Chande Momentum Oscillator completes another bearish divergence and peak lower, go short. This position is still opened.